Marine Magnetometer Processing Guide Book

This guide book was written as a short and simple explanation of how to understand, interpret and process data from marine magnetometers. The aim of the guide is to show how to take a set of information recorded from a marine magnetometer survey, to explain what it means and to enable you to produce some useful results.
The book is written in plain English and avoids the use of technical terms, those that are used are explained at the beginning. Lots of illustrations have been included as well as examples of magnetic anomalies and the objects such as the iron cannons and anchors that caused them.
The book is aimed specifically at the heritage sector but it also applies to other sectors such as unexploded ordnance (UXO) detection. The book includes a section for heritage resource managers that describes survey specifications for marine magnetometer surveys.
Click here to download a free copy of the book as a PDF document.
Written and illustrated by Peter Holt, 21x30cm (A4) paperback, 42 pages with 38 colour illustrations.
Reference: Holt P., 2014, Marine Magnetometer Processing, 3H Consulting Ltd., Plymouth
Book Extract, Pages 6-10:

1. Introduction to Magnetometer Processing
This guide is about processing data from marine magnetic surveys undertaken to locate and map archaeological sites underwater.
The aim of this guide is to show how to take a set of information recorded from a marine magnetometer survey, to explain what it means and to enable you to produce some useful results. The most usual requirement is to be able to identify any significant objects on the seabed, known as targets, within an area of seabed surveyed using a magnetometer. The targets can then be investigated using other remote sensing methods or directly by divers or an ROV. In this guide, data processing is explained from the basic principles to more advanced methods, followed by sections on producing reports and charts from the processed results.
Marine magnetic surveys that are undertaken to investigate shipwrecks and other archaeological sites usually cover a small area, but are done in great detail so the smallest iron (or steel) objects can be detected. Marine magnetic surveys for archaeology push the capabilities of the equipment and processing to the limit as the aim is to detect the smallest iron objects, despite often unfriendly environmental conditions and limited budgets. Magnetometer surveys are also undertaken for other reasons, although the basic principles are the same the processing is done differently:
• Processing data from archaeology surveys on land requires different techniques. The data from this kind of survey is usually much more detailed and distance from the target to the magnetic sensor is small, so much smaller anomalies can be identified. Coverage of the site is usually greater so it is easier to produce meaningful contour and 3D surface plots.
• The processing method used for large scale geological surveys is different as the size of the geological features is usually much larger than the survey line spacing.
• One field where the data processing is similar is unexploded ordnance (UXO) detection as the targets are of a similar size and the environment is the same.
This guide provides only a little information about data collection for marine magnetic surveys and only that which affects data processing. It includes a very basic explanation about the different types of marine magnetometer currently available but only including details which affect the quality and quantity of measurements that each type collects. The rate at which measurements are made, the amount of noise in the data, the position of the towfish relative to the target and other factors also are discussed.
There words used in the guide are intended to be as non-technical as possible but the technical terms that have to be included are described in the Definitions section.
This guide will be revised periodically so please send an email with any questions or comments as that will suggest improvements to be included in the next version.
Index
- 1. Introduction to Magnetometer Processing
- 2. Definition of Technical Terms
- 3. Basic Operation
- 4. Anomalies and Targets
- 5. Instruments, Signals and Noise
- Update Rate and Sample Interval
- Noise
- Practical Data Collection
- 6. Basic Processing
- Introduction
- Calculating Mass
- Survey Strategies
- Identifying Anomalies and Targets
- Using a chart
- 7. Further Processing
- Introduction
- Dealing with Spikes and Dropout
- Towfish Turns
- Other Contamination
- Dealing with the Effects of Geology
- Dealing with Diurnal Variation
- Levelling
- Wave Noise
- Calculating the Minimum Detectable Target
- Cables and Pipes
- 8. Reporting and Archiving
- Introduction
- Target List
- Metadata
- Charts
- Coverage Plot
- Minimum Detectable Target Plot
- Contour Plots and Surfaces
- Archiving
- 9. Bibliography
2. Definitions
Altimeter
An instrument for measuring the height of a towfish above the seabed
Anomaly
A variation in the magnetic field measured by a magnetometer
Background field
The magnetic field value in an area that is not affected by iron objects
CSV
Comma Separated Variable, a common computer file format
Distortion
A bend or a change in shape
Diurnal variation
The change in magnetic field over time caused by the effects of the sun
Ferrous
Ferrous metals are based on iron and many have magnetic properties
Field strength
A measure of the magnetic field at a point
gamma
The Imperial units of magnetic field strength, equivalent to a nanoTesla (nT)
GIS
Geographic Information System, a computer program designed to show maps, survey results and other spatial data
Gradiometer
A multi-sensor magnetometer that measures difference in field strength between two or more points
Induced magnetisation
The magnetic field of an object caused or induced by the Earth’s magnetic field
Magnetometer
An instrument for measuring magnetic field strength
Metal detector
Pulse Induction metal detectors can detect many types of metal, they generate their own magnetic field and are not magnetometers
Minimum Detectable Target (MDT)
The target with the smallest mass of iron that can be reliably detected
nanoTesla (nT)
The SI units of magnetic field strength, equivalent to a gamma
Noise
The unwanted part of any magnetometer measurement. Each measurement is a combination of Signal and Noise
Noise floor
The noise level measured by a magnetometer without any magnetic anomalies present. The lower the noise floor the smaller the anomalies that can be detected.
Regional field
The magnetic field value in an area that is not affected by iron objects
Remanent or permanent magnetisation
The magnetic field that an object would create if the Earth’s magnetic field was not there
Residual field
The magnetic field values in an area once the Regional field has been removed
Sample interval
The interval in metres between each successive measurement
Sample rate
The rate at which the magnetometer makes measurements
Signal
The value magnetic field strength recorded by the magnetometer, with any Noise removed.
Target
A feature or object causing an Anomaly, usually made of iron or steel
Time-Series Plot or TS Plot
A graph showing how magnetic Field Strength changes over time
Wave noise
Noise in the magnetometer measurements caused by waves in the sea moving the magnetometer up and down.
3. Basic Operation
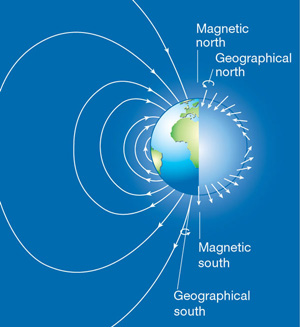
 Figure 2: Earth's magnetic field
A magnetometer is an instrument that measures the Earth’s magnetic field. A magnetometer can be used to locate submerged or buried iron objects both on land and on the seabed. Iron and other magnetic objects bend the Earth’s magnetic field around themselves, changing the shape of the magnetic field. A magnetometer can be used to measure the changes in the magnetic field around an iron object and these measurements can be used to detect the presence of the object itself.
Magnetometers used for marine surveys are passive, they do not transmit any signals, so do not have a working ‘range’ like a marine sonar. How far away they can detect an iron object largely depends on the size and shape of the object itself and how it lies within the Earth’s magnetic field; the object will bend the Earth’s magnetic field and the magnetometer can measure that distortion, so the bigger the effect of the object the further away it can be detected. Magnetometers are also not directional so will detect distortions in the magnetic field caused by objects anywhere around the magnetometer sensor. A magnetometer being towed over a steel shipwreck will give a similar response as it would if a steel ship on the surface sailed past the magnetometer.
Magnetometers can measure changes in the Earth’s magnetic field and do not directly detect iron objects. Only objects that have magnetic properties can affect the Earth’s field such as iron and steel (known as ferrous materials), whereas copper, brass, wood, gold and aluminium do not. Some ceramics have magnetic properties but the effects are small and hard to detect during marine surveys. The magnetometer would have to pass very close to the ceramics to be able to detect their effect on the Earth’s magnetic field, closer than can usually be achieved with towed marine magnetic surveys, making cargoes of ceramics almost impossible to detect during surveys at sea.
Magnetometers are not the same as metal detectors. Pulse induction metal detectors work in a different way as they make their own magnetic field which is then affected by other types of metal. Metal detectors can detect iron, copper, brass, gold and aluminium but not wood or most types of pottery. Metal detectors have a very short range, less than 300mm (1 ft) for a typical hand held unit, so are of limited use for most marine remote sensing surveys.
The Earth has a magnetic field similar to a large bar magnet (Fig. 2). The magnetic field of the Earth is not even and uniform, it varies according to where you are on the planet. Magnetic field strength is measured in Teslas (T) but the values of the Earth’s field are so small we usually refer to values in nanoTeslas (nT). Field strength is sometimes measured in gammas which are equivalent to nanoTeslas, so one gamma = one nanoTesla. The strength of the magnetic field at different places on the Earth varies from 60,000 nT in parts of northern Canada to 24,000 nT in Brazil.
Iron and Steel
A magnetometer will detect ferrous or iron-based metal, this includes wrought iron, cast iron and steel. In the book we will just refer to iron but this includes all ferrous or iron-based metals.
Over small areas covered by marine surveys the magnetic field does not change very much, so with no magnetic objects nearby a magnetometer would read the same value over the whole survey area. However, many rocks are magnetic so the underlying geology can affect the magnetic field measured in a survey area. Often this is seen as a gradual change in the field measurements over the site with one area showing a higher magnetic field measurement than another. The effect is often very noticeable so magnetometers have been used for prospecting for minerals buried beneath the ground.
The magnetic field at a point on the Earth also changes with time, an effect known as diurnal variation. This is caused by the rotation of the Earth within the magnetosphere as different parts of the Earth face the sun and forms a regular daily cycle. Diurnal variation can cause the magnetic field measured at a place on Earth to be different in the morning and in the afternoon. Solar storms can also affect the Earth’s magnetic field causing large changes in the background magnetic field strength.
4. Anomalies and Targets

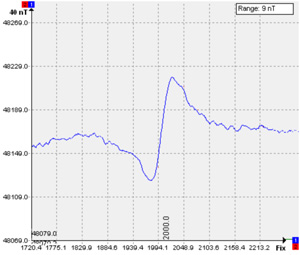
Fig. 3: Time-series plot
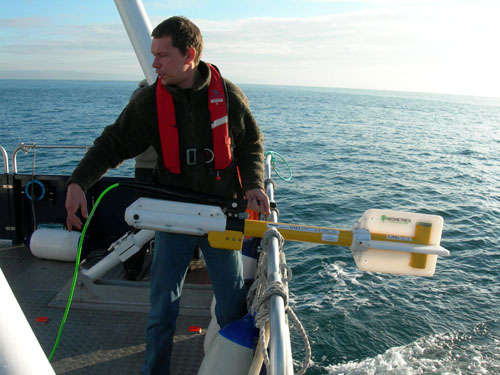
On a typical marine magnetometer survey the magnetometer sensor is towed underwater on a cable behind a boat. The magnetometer is connected to a computer that continuously records the magnetic field strength reported by the magnetometer as well as the position of the boat from a GPS receiver. The computer will display the measurements from the magnetometer on a time-series (TS) plot or strip chart with the magnetic field values shown on the Y axis and the time of each measurement or fix number on the X axis (Fig. 3).
The blue line on the TS Plot in Figure 5 shows the raw magnetic measurements and the red line shows the same measurements slightly filtered to remove some of the high frequency noise caused by the instrument itself.
In an area where no magnetic objects can be found the magnetometer will report the same value each time and the line on the TS plot will be flat, this is known as the background field. The absolute value of the magnetic field depends on where you are on the Earth but this value does not affect how we interpret the data as we are simply looking for changes in the background field.
An iron or steel object will bend the Earth’s magnetic field. Where the magnetometer comes close to that object the magnetometer will travel through the distorted magnetic field and this shows up as changes in the measurements made by the magnetometer. The TS plot on the computer will show those changes as an up and down ‘wiggle’ in the line, as variations above and below the background field value (Fig. 6).
Targets and Anomalies
A Target is the name given to the actual object that caused the Anomaly or bend in the magnetic field that we measured. On any survey the same Target may be detected more than once on different survey lines, each survey line would have its own anomaly but all of them would relate to just one Target.
The size and shape of the ‘wiggle’ on the line can tell us something about the object or ‘target’ that caused it. Interpretation of magnetometer data is complicated because the size and shape of the wiggle or anomaly measured by the magnetometer depends on where the magnetometer passes through the distorted magnetic field caused by the target. To make matters more complicated the shape of the anomaly will vary for the same object put in different places on the Earth and may also change depending on the orientation of the object. These problems are discussed further in the section on Advanced Processing.
End of the extract.
