

|
Techniques > Sites > Stella 1
Site: Surveying and Recording Stella 1
Techniques: 3D Trilateration, planning frames, bubble level, vertical profiles

The Anaxum Project is an investigation of the ancient waterway system which surrounded the Roman city of Aquileia, the most important commercial hub of the northern Adriatic area before its utter destruction by Attila (A.D. 452) and the Lombards (A.D. 590), which caused its inhabitants to flee to the nearby lagoon and establish Venice.
The 2011 field season was funded by the US research foundation ProMare. The work began with the excavation of a first century A.D. sewn boat, sunk in 5 m of water in the Stella River (Palazzolodello Stella, UD) (Fig. 1). This ship was built at the beginning of the Roman Imperial Age using archaic techniques
The ship was carrying a cargo of Roman tiles when it sunk, a small collection of Dressel 2/4 and Lamboglia amphoras, presumably for the use of the crew, iron carpenter's tools, a small wicker basket, and some ceramic artifacts, presumably for personal use. Stamps on the tiles indicate local production. The 2011 team focused on recording the extant hull structure for the purpose of reconstructing the vessel in order to better understand its construction techniques.
Survey and Recording Strategy
.jpg) Fig. 1: The Stella River |
.jpg) Fig. 2: Recording timbers |
.jpg) Fig. 3: Recording a timber profile |
2.jpg) Fig. 4: Geotextile cover design |
The wreck lies on the side of a tidal river in 5m water depth. Water currents vary according to the state of the tide, visibility is only a metre or two at best and drops to zero after it has rained (Fig. 2). Excavating the fragile timbers would leave them exposed to the effects of the current so a cover made from Terram geotextile and steel scaffold poles that could be draped over the site at the end of each day. Surveying was done using 3D tape trilateration (DSM), some survey work had previously been done on the site so the larger 2011 control point network also incorporated the previously installed control points. The control poits were used to position a number of detail points on the structure itself which were used to position timber drawings and planning frame drawings on the site plan. The usual method of employing a digital dive computer to measure depths was found to be not precise enough so a bubble level was constructed. A profiling bar was also built and used to record vertical profiles over the hull (Fig. 3).
Horizontal Control
Horizontal position control on site was provided by a network of 10 fixed and rigid survey control points installed inside and around the site. Five control points had been installed during the previous excavation which were supplemented with new points CP_1 to CP_5 added in 2011.
.jpg)
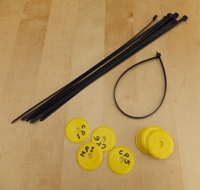
Fig. 5: Ground anchor
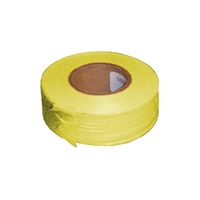
Points CP1 to CP5 are galvanised mild steel ground anchors screwed into the soft seabed (Fig. 5). After leaving to settle for 24 hours, the steel anchors provided a sufficiently fixed and rigid point to attach a tape measure for detailed survey work (Fig 4). There was no clearly identifiable point on each upper ring to make a measurement to so a black cable tie was added to each to serve as a measurement point. Each point was clearly labelled with a yellow Disk-mark and bright yellow flagging tape was added to make the anchors easier to locate in the poor visibility underwater.
The points from the original survey CP_W, CP_X, CP_Y and CP_Z were made from 30mm angle section mild steel ‘speedframe’ driven into the seabed around the main hull structure. Points CP_Y and CP_W were in good condition but CP_X was slightly loose while CP_Z had been bent flat to the seabed. The angle section steel did not provide any convenient point to attach a tape measure so 8mm steel and plastic rods were fixed to the top of each point for this purpose. The rods were fixings for attaching insulating wall sections found in a local builders merchant, they were made more visible by covering the upper length with stripes of black and yellow electrical tape then they were firmly attached to the angle section using cable ties. A single black cable tie on each rod marked the point to make measurements to. Each point was clearly labelled with a yellow Disk-mark and bright yellow flagging tape was added to make the points easier to locate in the poor visibility. Measurements were made between the points using a conventional fibreglass tape measure. The tape measure had a loop attachment on the free end which could be tied to a point using a releasable plastic cable tie. There was a gap between the end of the loop and the zero point on the tape measure so all the measurements were corrected for this additional distance offset. The survey points CP_W to CP_Z had been positioned previously with a total station using a reflector mounted on a long survey staff, the positions of the points were added to the survey calculations and were used to help define the real-world co-ordinates of the site. It was originally planned to extend work on the site to include areas away from the main hull itself so a control point network was installed that covered a much larger area than was actually used to record the hull timbers. It is expected that the control points used for this job will survive in situ for many years so the additional points should be available for use during any subsequent work.
.jpg) Fig. 6: Primary control points |
.jpg) Fig. 7: Detail points |
.jpg) Fig. 8: Hull timber plan |
.jpg) Fig. 9: Hull and cargo scatter |
Vertical Control
The site is subject to changes in tide height so all depth measurements were made relative to a single depth reference point to allow the measured values to be corrected. The survey point chosen was CP2 as this was the main point of access to the site and would be passed by divers as they arrive and leave. The depth reference point was given an arbitrary nominated depth so measurements made to it would define the tide height correction to apply to all other depth measurements, so making the relative depths of all of the points correct relative to this arbitrary level. The same dive computer (Suunto Vyper) was used for all depth measurements to remove the effects of variation in depth measurements between instruments.
.jpg)
Fig. 10: Bubble gauge
The depth measurement procedure was as follows. A depth measurement was made a CP2 using the dive computer and the time of the measurement was noted. Depth measurements were then made at other points and the times noted. Lastly, a second depth measurement was made at the depth reference point CP2 and the time recorded. The difference between depth measurements made at CP2 at the beginning and end of the measurement sequence gives the change in depth due to the effects of tide. Thus each other depth can be corrected for tide height at the time of measurement by a simple calculation. In practice, the time between first and last measurement was short so the change in tide height over that time could be ignored and only the difference between nominated depth and measured depth be applied.
It was found during on-site processing that the measurements from the dive computer were not precise enough and were degrading the quality of the computed 3D point positions; the dive computer only reports depth to a resolution of 100mm which limits the precision of the measurements. The only option available at the time was to build a bubble level and to level the survey points in by hand; this ancient technology device uses a bubble of air to accurately transfer a known level from one point on the site to other points on the site. The bubble level was constructed using materials at hand and available at a local builders merchant (Fig. 10). A 7m length of 10mm diameter clear plastic tube used for winemaking was used to contain the bubble then the top of a plastic drink bottle was attached to the hose at the fixed or reference end so the hose could be filled with air underwater from a diver’s regulator. The free end of the plastic hose was attached to an aluminium scale bar and weighted with a small lead weight so the free end would fall to the seabed if dropped and not let the air in the tube escape.
In use the bubble level was attached to the shallowest control point so all measurements were made below this level. The plastic tube was filled completely full of air and the difference in height was noted between the control point reference and the lower level of the air bubble at the fixed end of the tube. The free end of the tube was then moved around the site by a pair of divers and for each control and detail point the relative height of the bubble above the point was measured with a 1m plastic rule to a resolution of 1mm.
A number of points were recorded both at the beginning and end of each levelling run as a confidence check to ensure that no air had escaped from the tube during the recording process. Closed loop tests on the depths measured by the bubble gauge gave repeatability in measurements of between 0 and 10mm. The limited resolution of the dive computer should give differences in measured depth the order of 50 to 100mm however the differences between computer and bubble gauge are larger suggesting other factors are limiting the accuracy of the computer's depth measurements.
Detail Points
Measurements from the primary control point network were used to position detail survey points on the hull and on features around the site (Fig. 7). Detail points had been added to the hull timbers during the survey in 1999 and a number of these points still remained attached to the hull. Additional points were placed on the ceiling planks and frames in 2011 to provide reference points for the timber recording. Mapping pins were initially used for the new detail points (DP_1 to DP_38) but the timbers were too soft to support them and many fell out during the work on site. Nails through plastic tags were then used for the next set of points added to the hull (DP_11x) and these were more successful.
The names used for the detail points evolved as the survey proceeded. It became necessary to differentiate between detail points added on different dates so the year the point was added was included in the name. For the majority of the points the name is in the form DP_YYxny, where ‘DP’ identifies the point as a detail point, YY is a two digit year code either 99 or 11, x is a letter code identifying the timber type O for ceiling plank or P for frame, n is the timber number and y is a sequence letter identifying a particular detail point on a timber.
Position Computation
The positions of the primary survey control points were calculated by combining the distance, depth and surface position measurements using the Site Recorder 4 computer program (version 4.25.7). The program calculates the best estimate of the position of the points, an estimate of the position error for each point and calculates quality metrics for each of the measurements using a survey quality least-squares adjustment. Any measurements that were found to be in error were re-measured and the point positions recalculated. As the surface position measurements were included in the position calculation the computed positions for the points were automatically given in real-world co-ordinates. The estimate of error used in the adjustment for distance measurements was 30mm and for depth measurements it was 100mm. The primary adjustment of the 10 control points used 42 measurements giving an adequate redundancy of 12. The post-computed RMS residuals for the distance measurements was 8mm, 5mm for depth measurements and 29mm for the four position measurements. Surface positions from total station had little effect on the shape of the network and were only used to constrain its position in real world co-ordinates. No secondary control points were used in the network as the site was small and low lying.
The 51 detail points were positioned using 235 measurements and produced post-computed residuals of 11mm for distance measurements and 16mm for depths. The majority of points were positioned using four or more distance measurements plus a depth measurement however some points that did not survive for long were only positioned with two or three measurements so their positions are less reliable. These points include DP_2, DP_11, DP_13, DP_17, DP_20, DP_25, DP_34 and DP_11O8A. Only one measurement was made to DP_11O3A_x and DP_11P5A_x before they were lost so the points were not included on the site plan.
Hull Profiles
.jpg)
Fig. 11: Profile bar
in addition to positioning the ship structure for the site plan it was also necessary to record the profile of the timbers as they lay on the seabed. This required relative height measurements to be made in great detail so a profiling bar was built; the bar could be set up over the timbers and used as a reference for distance measurements between the bar and the upper face of the timbers.
The bar was built from aluminium angle section obtained at a local builders merchant as the resulting structure was light so it could be easily handled underwater and sufficiently rigid to be used as a reference. Tests on the bar on the dockside showed that the deflection in the middle of the bar due to sagging was negligable.
Once installed on site iIt was not easy to level the bar on the seabed so the ends of the bar were levelled in to the site depth datum and any slope in the bar dealt with in post-processing. In use, an aluminium metre scale bar was used as the vertical reference so a measurement could be made between the bar and the timber. The scale bar was kept vertical during each measurement using a bubble level attached to it.
Related Pages
Bibliography and Links
-
Bartoli D., Capulli M., Holt P., 2012, Creating a GIS for the Underwater Research Project "Anaxum": the Stella 1 Shipwreck, NTA-2012 Proceedings of the 2nd Workshop on The New Technologies for Aquileia, CEUR Workshop Proceedings Vol 948