
Techniques > Sites > The Barrel Wreck
Site: Surveying the Barrel Wreck
Techniques: 3D Trilateration,Planning frames, Sketching, Bathymetry


|
In 2011 the South African Heritage Resources Agency (SAHRA) ran an international fieldschool based at Robben Island off Cape Town, South Africa. SAHRA are the national administrative body responsible for the protection of South Africa’s cultural heritage. The fieldschool was funded by the Centre for International Heritage Activities (CIE).
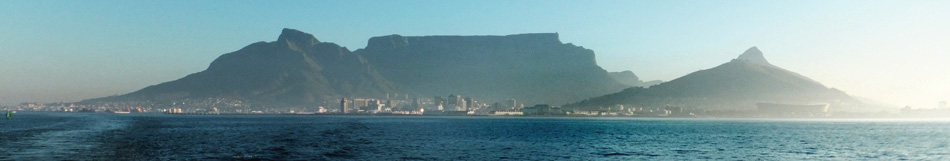
The Barrel Wreck was investigated during original survey fieldschool Feb 2011. The wreckage known as the Barrel Wreck or the Musket Wreck is located approximately 200m off Dolphins Beach at Blouberg Strand, Table Bay, South Africa. The wreckage is located between 4 and 7m below the surface. The fieldschool produced a plan of the site and some detailed records of features on the site.
In January 2012 during a second fieldschool the Barrel Wreck was resurveyed using 3D trilateration and Site Recorder and the results of this work are shown below.
All figures except 1 are taken from the Site Recorder file for the Barrel Wreck, courtesy of SAHRA.
Click on any image below to show a larger version.
Installing Survey Control
The aim of the 2012 survey was to extend the existing survey control point network the calculate the position of the control points using 3D trilateration. An assessment survey created during the 2100 fieldschool had produced a plan of the 50m x 20m (164ft x 66ft) site (Fig. 1), this had positioned the main features on the site but showed an unusual curve in the line of the keel. The assessment survey plan was scanned and imported in to Site Recorder as an image basemap, positioned using the known location of the site, oriented with the plan's north arrow then scaled to fit using the scale on the plan. The outline of the original plan was then traced on to the digital site plan in Site Recorder.
A primary control point network was designed around the digitised plan and included the survey control points installed in the previous year. The control points were hammered into the sandy seabed every 10m along either side of the hull ensuring that tape measurements used to position the points would be less than the maximum length of 20m. The wreck structure stands three metres proud of a flat sand seabed so it was not possible to measure directly from one side of the wreck to the other for most of its length. So in 2012 secondary control points (CP26-31) were installed on the wreck structure, along the highest part of the wreck along its northern edge (Fig. 2). More about network design...
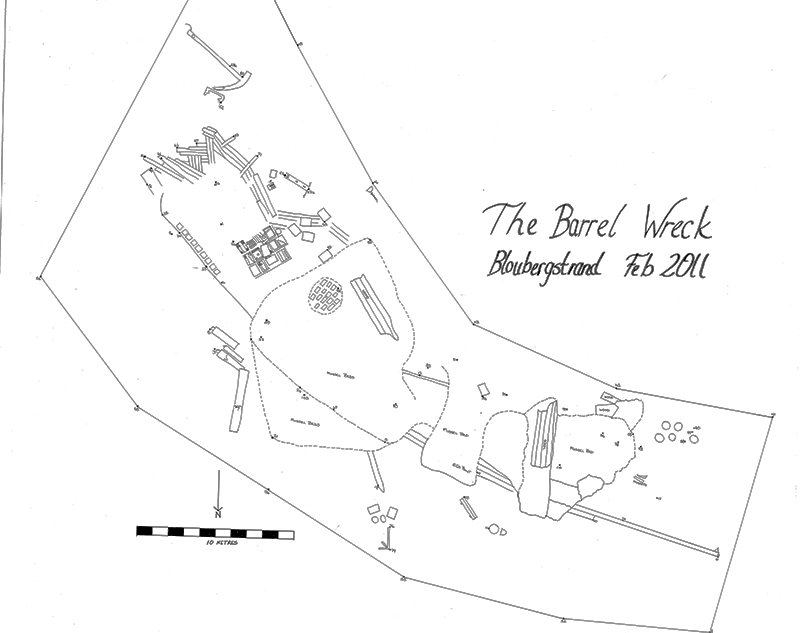
Fig 1: The 2011 plan of the site, drawn south upwards
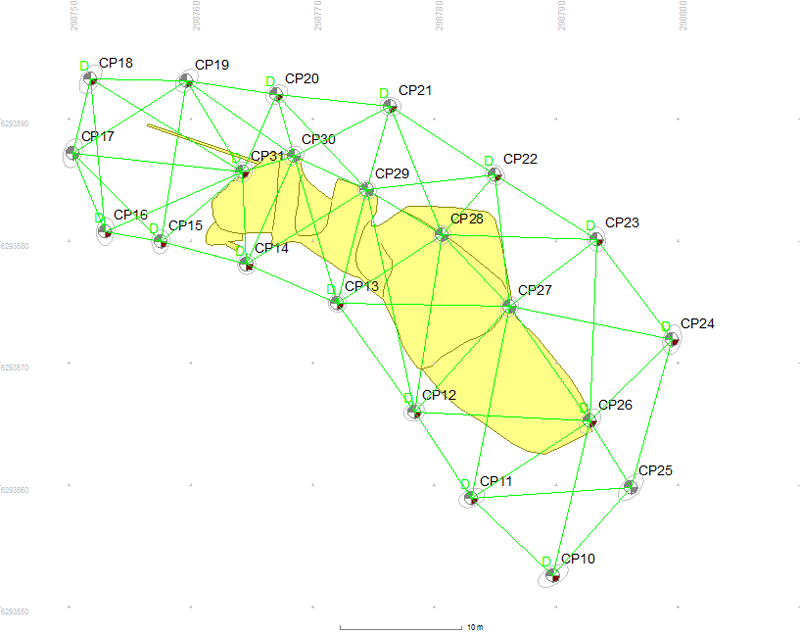
Fig 2: The control point network design based on the 2011 plan
Distance measurements were made between sets of four control points forming the usual braced quad shapes ensuring that the network was positioned using the minimum number of high quality measurements. A depth measurement was made at each control point using the same dive computer to ensure consistency and correcting all the measurements for the effects of tide. GPS surface position fixes were taken at the extreme ends of the site (CP25 and 17) and were added to Site Recorder. More about GPS position fixes...
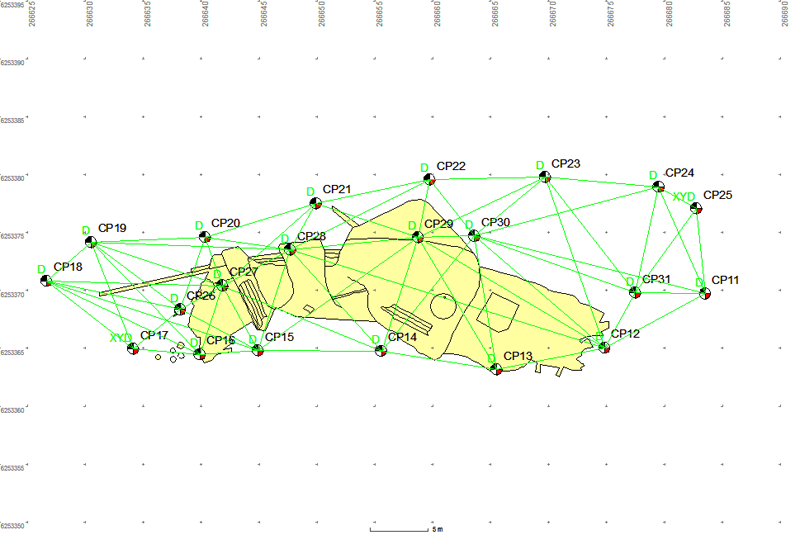
Fig 3: The 2012 CP Network shown over the original hull sketch

Fig 4: The straightened and aligned hull sketch with control points
The distance, depth and surface positions were used by Site Recorder to calculate the positions of the control points with the measurements fitting together to an acceptable 49mm (RMS). After adjustment the points moved from the planned shape in Fig. 2 to the actual network shape shown in Fig. 3 removing the unusual curve in the hull and straightening up the line of the keel. The alignment of the hull was also corrected by the adjustment so the site aligned east-west; the error in the original north-west / south-east alignment was probably caused by measuring the alignment using a divers magnetic compass which would have been affected by the large pile of iron cargo in the middle of the site. The control point network was positioned and aligned using GPS surface positions at the extreme ends of the site so was unaffected by the iron cargo on the ship. Based on the actual control point positions the outline of the hull was then redrawn (Fig. 4).
This is a good example of why 3D trilateration control networks should be used for survey control on large shipwreck sites. The previous recording method produced a plan that looked reasonable and included all of the features on the site (Fig. 1) but proved to be very distorted in shape and was at the wrong alignment when resurveyed using survey control (Fig. 4).
Detail Recording using Planning Frames
Towards the east end of the site a number of barrels were visible on the seabed which needed to be recorded. A baseline was laid across the site at that point and positioned using a detail survey point at each end (DP1 & 2) which themselves were surveyed in to the control points using distance and depth measurements. Planning frames 1m x 1m were laid along both sides of the baseline so the features underneath could be drawn. The drawings were scanned, imported in to Site Recorder as Drawing Frame objects (Fig. 5), positioned using the baseline and traced to add detail to the site plan (Fig. 6). More about planning frames...
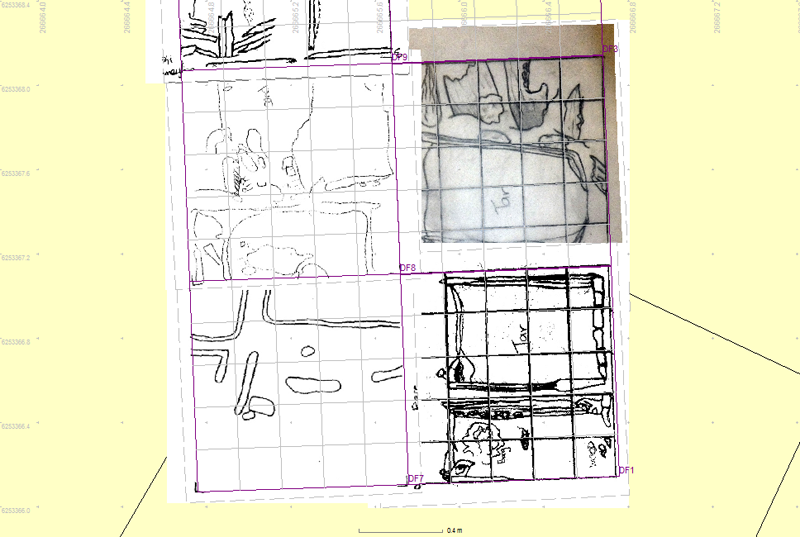
Fig 5: Scanned planning frame drawings in Site Recorder

Fig 6: Digitising the scanned planning frame drawings on to the main site plan
Depth Measurements
The concreted iron cargo of the ship is one of the most significant features as it stands proud above the seabed making recording work more difficult. To record the shape of the wreck a series of depth measurements were made across the site, these were done as a series of transects across the site as well as spot measurements at known locations such as control points (Fig. 7). The depth measurements were added to Site Recorder as Data Points then they were exported as an XYZ file and used to generate a contour plot of the height of the wreck structure using Surfer (Fig. 8).
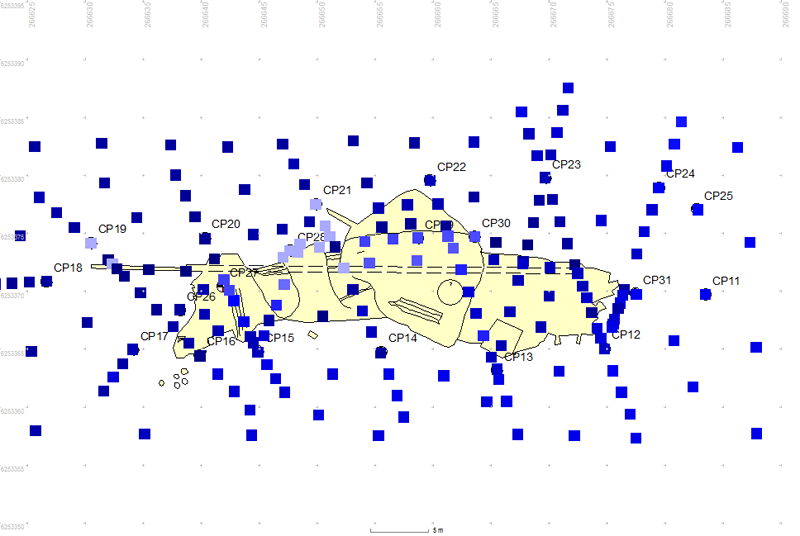
Fig 7: Depth transects and point depth measurements

Fig 8: Height of the wreck shown as a contour plot